
Seats Per Party
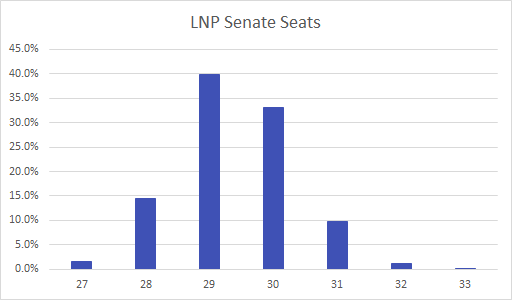
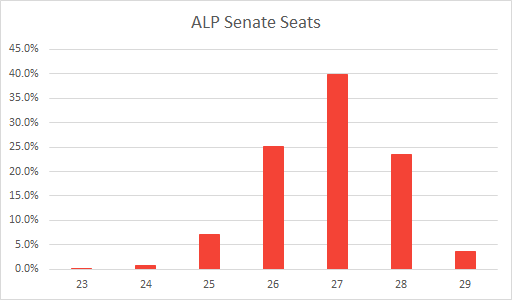
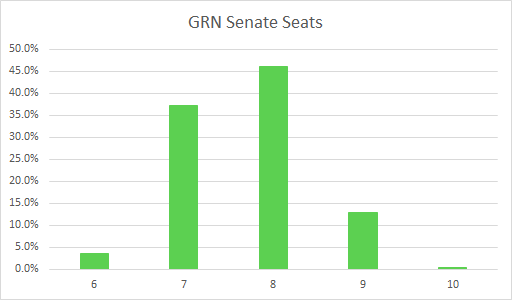
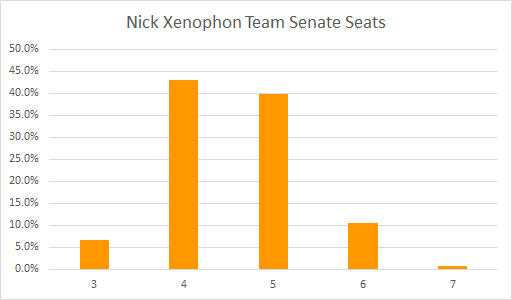
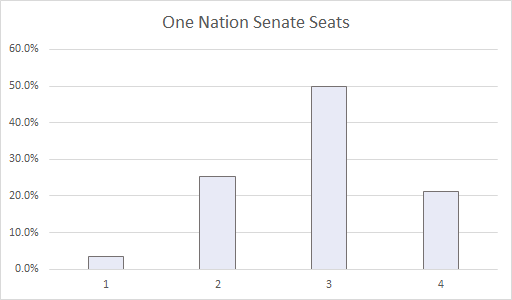
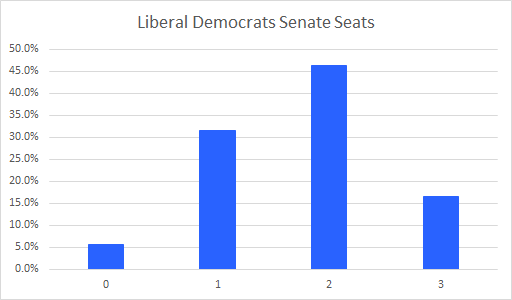
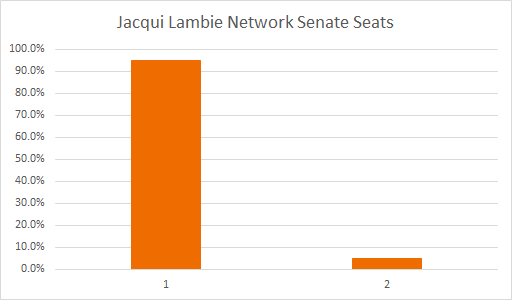
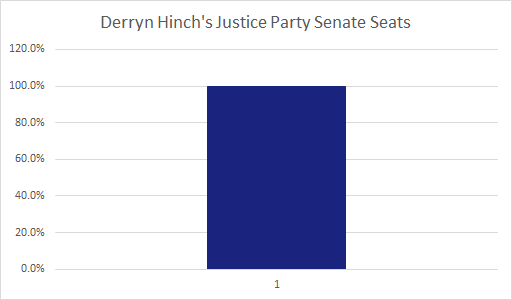
July 3, 2016 | 07:35 | Federal | 2016 | SenateSo, what are the probabilities of each of the parties getting a certain number of seats? I’m glad you asked:
Updated: 2016/07/05 11:38am
I will update this post with some more explanation, information and up-to-date models. I just wanted to push these graphs out asap.
Some of these results are genuinely outlandish (e.g. The Nick Xenophon Team picking up a 4th seat in SA if their vote picks up substantially) and are modelled on parties being clustered Extreme Left, Left, Centric, Right or Extreme Right (as well as majors modelled seperately). I would be more conservative on minor party seats, being replaced by major party seats, when reading these graphs. I will be lowering my variance in line with the votes counted (~50% of Enrolled persons nation wide) in a follow up post tonight.
Honestly, this feels pretty crazy. I want to trust my models; and the evidence shows that there’s a lot of vote dispersion below the line (Extreme Right parties don’t always preference Extreme Right parties, they move pretty evenly to the Right, Central and Extreme Right [and about 5-10% left]). But there’s so much unknown about previous above the line voters, that their preferences will probably fail to follow this pattern, and could very well cluster strongly (Christian Right + LNP inter-preferencing will lead to a CDP senator over the LDP or other Major in NSW).
Taking maximum probabilities of parties gives the following senate breakdown:
| Party | Seats | Notes |
|---|---|---|
| Liberal National Coalition | 29 | Probably More |
| Australian Labor Party | 27 | Probably More |
| The Greens | 8 | About Right |
| Nick Xenophon Team | 4 | About Right |
| Pauline Hanson’s One Nation | 3 | Probably Fewer |
| Liberal Democrats | 2 | Probably Fewer |
| Derryn Hinch’s Justice Party | 1 | About Right |
| Jacqui Lambie Network | 1 | About Right |
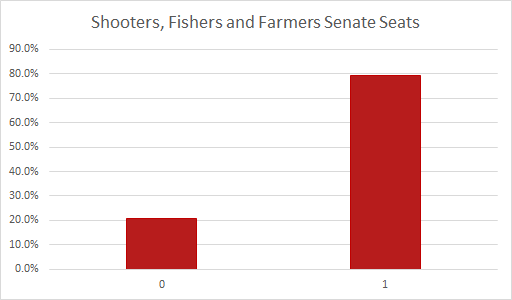
| Shooters, Fishers and Farmers | 1 | About Right |