
Victorian Upper House Overview
November 18, 2018 | 12:30 | State | VIC | 2018 | Upper-HouseAnother year, another upper house election with Group Voting Tickets being dominated by micro-party back room deals!
Although I am a fan of doing all this analysis, and Group Voting Tickets makes this way more mathematically fun … we really need to change this system.
Ok so who’s going to get elected?
So this is a table of the probable outcomes for all of the different regions in the state.
This table isn’t meant to represent the true final probabilities of election, but highlights the parties that are well-placed to win seats in the upper house through preference harvesting. I have also applied a swing of about 3% against the LNP since 2014.
| Party | Total | EMR | EVR | NMR | NVR | SEMR | SMR | WMR | WVR |
|---|---|---|---|---|---|---|---|---|---|
| Liberal / National Coalition | 13.28 | 2.03 | 1.93 | 0.79 | 1.92 | 1.57 | 2.2 | 1.13 | 1.72 |
| Australian Labor Party | 16.3 | 1.68 | 1.89 | 2.39 | 1.65 | 2.48 | 1.46 | 2.66 | 2.09 |
| The Australian Greens | 2.97 | 0.39 | 0.28 | 0.8 | 0.14 | 0.16 | 0.6 | 0.42 | 0.19 |
| Liberal Democrats | 2.47 | 0.25 | 0.33 | 0.01 | 0.87 | 0.63 | 0.06 | 0.25 | 0.08 |
| Derryn Hinch’s Justice Party | 2.23 | 0.14 | 0.03 | 0.82 | 0.13 | 0.07 | 0.16 | 0.19 | 0.67 |
| Reason Party | 0.64 | 0 | 0.04 | 0.18 | 0.02 | 0.04 | 0.17 | 0.12 | 0.07 |
| Shooters, Fishers & Farmers | 0.52 | 0 | 0.36 | 0 | 0.09 | 0 | 0 | 0.06 | 0.01 |
| Animal Justice Party | 0.51 | 0 | 0.14 | 0.01 | 0.02 | 0.03 | 0.21 | 0 | 0.09 |
| Health Party | 0.36 | 0.27 | 0 | 0 | 0 | 0 | 0.05 | 0.05 | 0 |
| Democratic Labour Party | 0.24 | 0 | 0 | 0 | 0.12 | 0.02 | 0 | 0.11 | 0 |
| Transport Matters | 0.24 | 0.24 | 0 | 0 | 0 | 0 | 0 | 0 | 0 |
| Sustainable Australia | 0.09 | 0 | 0 | 0 | 0 | 0 | 0.09 | 0 | 0 |
| Australian Country Party | 0.05 | 0 | 0 | 0 | 0.05 | 0 | 0 | 0 | 0 |
| Aussie Battler Party | 0.01 | 0 | 0 | 0 | 0 | 0 | 0 | 0.01 | 0 |
Which we can contrast with the previous actual election results:
| Party | Total | EMR | EVR | NMR | NVR | SEMR | SMR | WMR | WVR |
|---|---|---|---|---|---|---|---|---|---|
| Liberal / National Coalition | 16 | 3 | 2 | 1 | 2 | 2 | 3 | 1 | 2 |
| Australian Labor Party | 14 | 1 | 2 | 2 | 2 | 2 | 1 | 2 | 2 |
| The Australian Greens | 5 | 1 | 0 | 1 | 0 | 1 | 1 | 1 | 0 |
| Reason Party | 1 | 0 | 0 | 1 | 0 | 0 | 0 | 0 | 0 |
| Shooters, Fishers & Farmers | 2 | 0 | 1 | 0 | 1 | 0 | 0 | 0 | 0 |
| Democratic Labour Party | 1 | 0 | 0 | 0 | 0 | 0 | 0 | 1 | 0 |
| Vote 1 Local Jobs | 1 | 0 | 0 | 0 | 0 | 0 | 0 | 0 | 1 |
What does this mean?
Victoria has eight regions where voters in each region elect five different members, giving a total of 40 members to the upper house.
Five is an important number, and in stark contrast to the even numbers elected in other state and federal upper house elections (e.g. 6 per region in Western Australia, and 6/12 Federally).
In an election which is evenly matched in the lower house between two major parties, this leads, more often than not, to the fifth and final seat going to a minor or micro party. Combine this with Group Voting Tickets and you have a recipe for chaos.
The above table represents the average expected number of seats from each region, for each of the aforementioned parties. Some of the parties you will certanily not have heard of. These are the micro parties that have orchestracted Group Voting Ticket preference harvesting to benefit their members, leading to a snowball effect for one of the parties.
Here are some example micro parties, with their required primary vote percent to give them a fifty-fifty chance at winning a seat. (For comparison, the Australian Greens will need close to 12% to get a seat anywhere)
- Eastern Metropolitan Region
- Transport Matters Party: 0.25%
- Health Australia Party: 1.8%
- South Eastern Metropolitan Region
- Liberal Democrats: 2.2% (Poor ballot placement will affect them here)
- Western Metropolitan Region
- Aussie Battler Party: 0.5%
- Shooters, Fishers & Farmers: 2.1%
In general, apart from the Eastern Metropolitan Region, any of the major microparties (LDP, DHJ, AJP, Reason, SFFP) who accrue around 3-4% in primary vote have a good chance of getting a preference harvest, and won’t be snowballed by a candidate on a tiny vote.
But what’s changed since last time?
2014 was a long time ago. Clive Palmer was a member of Federal Parliament, Pauline Hanson wasn’t, and Tony Abbott was prime minister. There’s been a lot of shakeup in the political landscape:
- Palmer United Party isn’t running this time
- The explicitly religious parties aren’t running either: Family First, and Australian Christians
- Derryn Hinch is in Federal Parliament and is running candidates in every region under his banner
- The Sex Party has renamed to Fiona Patten’s Reason Party
I think there’s too much going on to give an accurate perspective on how the state will vote.
Can I make any guarantees?
Yes. Wherever the Liberal Democrats appear to the left of the Liberal party on the ballot, they will poll between 3.8% and 4.3%. Where they appear to the right, they will poll between 1.3% and 2.2%.
Do you have any pictures to explain this?
Yep, and I’m also working on a nicer one which shows the threshold a party needs to reach to have a good chance of getting a seat.
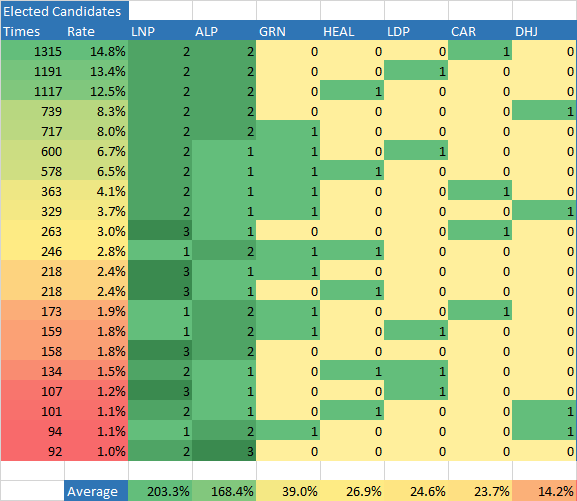
Here’s the potential makeup of the Eastern Metropolitan Region, each row represents a different electoral outcome (the first row, for example, is two Liberals, two Labor and one Transport Matters)
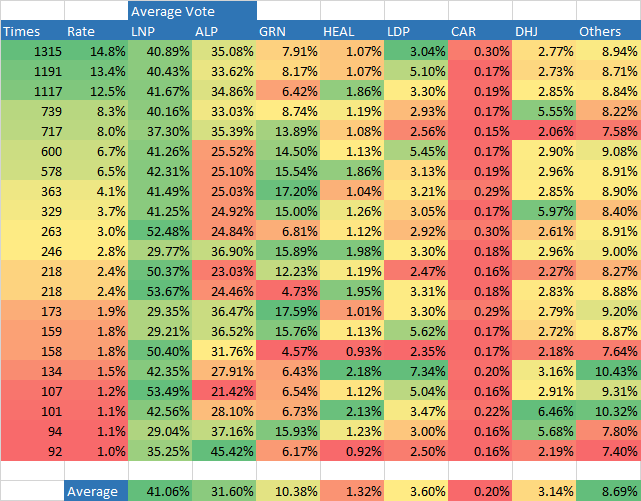
And the average percent of the vote each of the parties received to get that result:
Ok, so what should I do now?
Vote below the line. Don’t let the parties decicde where your vote goes!
But Tom, tell me more!
I will do in depth analyses of all eight regions over the coming days. Keep an eye out!